Databricks Security Alerts in Azure

Introduction
Through a LinkedIn connection at Obsidian Security, I found a link to a Security Best Practices For Azure Databricks document. The document includes threat models for 7 attack types as well as Protect, Detect, and Respond recommendations for each.
- Account takeover or compromise
- Data exfiltration
- Insider threats
- Supply chain attacks
- Potential compromise of Databricks
- Ransomware attacks
- Resource abuse such as crypto mining
As a Detection Engineer I thought I would go through all the Detect recommendations and see if I could write alerts for as many of them as possible. So here are the results of that work using Azure Sentinel/Log Analytics Workspace and Kusto Query Language (KQL) queries. I also looked at each Protect and Respond recommendation to see if any of those were query-able items.
This non-exhaustive list of queries may help you get started on your Databricks monitoring journey.
Account takeover or compromise
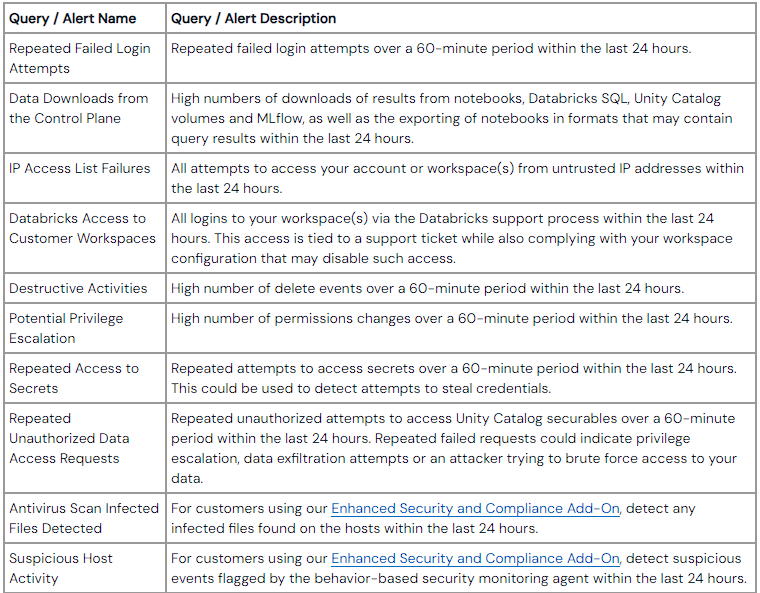
This recommendation linked to a Databricks blog article that included many recommendations but specifically a "Quick start notebook" of recommended queries.
There is a link in the article to a repo of queries to cover these recommendations in Databricks itself, but for my purposes, I wanted them in Azure Sentinel.
Repeated Failed Login Attempts
I specifically want to detect two things here: 1) credential stuffing attacks and/or brute force and 2) password spraying. To detect these two events I wrote two queries.
- A query to detect a "high" number of failed logons in the past 60 minutes for a single user
- A query to detect a "high" number of failed logons across the environment independent of user in the past 60 minutes.
"High" is quoted because this number will differ by environment and will require tuning to find the right number of failed logons. In my case, for the first query, any more than 2 failed logons per use and any more than 4 globally are suspicious. Looking back 90 days, this yields a reasonable number of events that I am not worried about the additional noise.
Query for user account credential stuffing or brute force:
DatabricksAccounts
    // Unsuccessful logon attempts are responses other than 200
    | where Response !contains "200"
    // 60 minute time buckets
    | summarize count() by RequestParams, bin(TimeGenerated, 60m)
    | extend bucket_time = TimeGenerated
    // Sus if more than 2 failed logons within an hour
    | where count_ > <set as appropriate for your env>
    // Join the full details back so that the result can have more information
    | join kind=inner (DatabricksAccounts) on RequestParams
    // Grab join only events within 2 minutes of the specified time bucket, otherwise we get ALL events for the user
    | where datetime_diff("minute", bucket_time, TimeGenerated1) < 2
    // Filter again on failures, opitionally, remove this filter to see if the user eventually logged in successfully
    // Continued failed logons after a success might indicate automated credential stuffing
    | where Response !contains "200"
    | project TimeGenerated1, RequestParams, count_, SourceIPAddress, UserAgent, ActionName, Response
Query for global password spraying:
DatabricksAccounts
    | where Response !contains "200"
    | summarize count() by Response, bin(TimeGenerated, 60m)
    | where count_ > <set as appropriate for your env>
    | join kind=inner (DatabricksAccounts) on Response
    | where datetime_diff("minute", TimeGenerated, TimeGenerated1) < 2
    | project TimeGenerated1, RequestParams, count_, SourceIPAddress, UserAgent, ActionName, Response
Data Downloads from the Control Plane
The blog article recommends searching for high numbers of downloads from Notebook, Databricks SQL, Unity Catalog volumes and MLflow.
Notebooks
Based on the documentation there are two download events; downloadLargeResults and downloadPreviewResults in both cases, the events were rare enough in my environment to just look for both.
DatabricksNotebook
// Includes the downloadLargeResults and downloadPreviewResults Actions
| where ActionName startswith "download"
// Parse some JSON for easier filtering
| extend Identity=parse_json(Identity)
| extend RequestParams=parse_json(RequestParams)
// Filter out a common user/notebook pair as this is common activity we don't need to investigate.
| where (Identity.email != "<redacted>" and RequestParams.notebookId != "<redacted>>")
Databricks SQL
Only one download event to worry about here; downloadQueryResult. But, the events are much more numerous and harder to immediately investigate. Because of my team's workflows, almost all downloads are in a single file format. There are two events in our environment that will be of interest.
- Downloads of a filetype other than the one which is the common type for my team
- Daily download counts outside some multiple of the standard deviation for the user
Uncommon filetype downloads.
DatabricksSQL
| where ActionName startswith "download"
| extend RequestParams=parse_json(RequestParams)
| extend queryResultId = RequestParams.queryResultId
| extend Identity = parse_json(Identity)
// FileType other than 'filetype' is rare.
| where RequestParams.fileType != "filetype"
Daily download standard deviation anomalies. Note: This query is best implemented in a Workbook or as a Hunt Query due to Sentinel's Analytics Rules lookback limitation of 14 days. In my case, I wanted to look back 90 days to have enough data points for a standard deviation calculation.
let stddev = DatabricksSQL
// Only interested in download actions
| where ActionName startswith "download"
// Get number of download events per day per user
| summarize count() by tostring(Identity), bin(TimeGenerated, 1d)
// Calculate the stddev and average per user
| summarize avg(count_), stdev(count_) by Identity;
// Requery the table to get details back
DatabricksSQL
| where ActionName startswith "download"
| summarize count() by tostring(Identity), bin(TimeGenerated, 1d)
| join stddev on Identity
// Return results where the daily count is higher than a multiple of standard deviations and only when count is higher than average
| where count_ - avg_count_ > 1 * stdev_count_
// Filter out results where a user only has one event (all events in one day) and is below a certain number of events.
| where not(stdev_count_ == 0 and count_ == avg_count_ and count_ < 3)
Unity Catalog Volumes
We have one action this is fairly prevalent, but all other volume operations are rare and happen in close succession. So we can just alert on these on a per-day or every few hours basis.
DatabricksUnityCatalog
| where ActionName contains "Volume"
| where ActionName  != "<<prevalent_action>>"
MLFlow
Fairly easy with this one, any read events on MLFlow Artifacts. In our environment, this is rare.
IP Access List Failures
This one I actually already had an alert for. In my case, I am detecting any accesses that are not from our corporate network or VPN. I highly suggest utilizing automation and Watchlists to keep IP lists up to date. The msticpy library is good for automating Watchlist updates
let vpn_ranges = toscalar(_GetWatchlist('vpn_ranges')
    | summarize make_list(SearchKey));
//Manual office ranges
let office = dynamic(['1.1.1.1/16']);
DatabricksAccounts
| where ActionName != "tokenLogin"
| extend IPAddress = tostring(split(SourceIPAddress, ':')[0])
| where not(ipv4_is_in_any_range(tostring(IPAddress), vpn_ranges))
    and not(ipv4_is_in_any_range(tostring(IPAddress), office))
Databricks Access to Customer Workspaces
This one is easy as the DatabricksGenie table includes all such events, so any event in this table is worthy of an alert.
Destructive Activities.
Due to the large number of deletion operations in a cluster-style environment where resources are being created and destroyed frequently, this one requires another standard deviation calculation similar to the SQL download events. Again, this works better in a Workbook than as an alert due to the Sentinel Analytics Rule 14 day lookback limitation.
let stdev = union withsource=Tables_ Databricks*
| where ActionName startswith "delete"
| summarize count() by ServiceName, bin(TimeGenerated, 1d)
| summarize avg(count_), stdev(count_) by ServiceName;
union withsource=Tables_ Databricks*
| where ActionName startswith "delete"
| summarize count() by ServiceName, bin(TimeGenerated, 1d)
| join stdev on ServiceName
// Return results where the daily count is higher than a multiple of standard deviations and only when count is higher than average
| where count_ - avg_count_ > 1 * stdev_count_
// Filter out results where a user only has one event (all events in one day) and is below a certain number of events.
| where not(stdev_count_ == 0 and count_ == avg_count_ and count_ < 3)
Potential Privilege Escalation
Basically the same as the other standard deviation events.
let stdev = union withsource=Tables_ Databricks*
| where _ResourceId startswith "/subscriptions/dac908e1-d01f-4694-92ff-853e68c0692b"
| where ((ActionName contains "acl" or ActionName contains "permission") and ActionName !in ("metadataAndPermissionsSnapshot", "getEffectivePermissions", "showPermissions"))
| summarize count() by ServiceName, bin(TimeGenerated, 1d)
| summarize avg(count_), stdev(count_) by ServiceName;
union withsource=Tables_ Databricks*
| where _ResourceId startswith "/subscriptions/dac908e1-d01f-4694-92ff-853e68c0692b"
| where ((ActionName contains "acl" or ActionName contains "permission") and ActionName !in ("metadataAndPermissionsSnapshot", "getEffectivePermissions", "showPermissions"))
| summarize count() by ServiceName, bin(TimeGenerated, 1d)
| join stdev on ServiceName
// Return results where the daily count is higher than a multiple of standard deviations and only when count is higher than average
| where count_ - avg_count_ > 1 * stdev_count_
// Filter out results where a user only has one event (all events in one day) and is below a certain number of events.
| where not(stdev_count_ == 0 and count_ == avg_count_ and count_ < 3)
Repeated Access to Secrets
Again, because it is hard to pin down exact numbers, a time-based analysis will be useful here. I want to look for spikes secrets accesses. In our environment, user accesses are rare and a service account does about 1000 requests per day. So looking for departures from this norm will be ideal. Standard deviation could work here but given the fairly consistent numbers, I think this would create a lot of false positives.
let endtime = ago(90d);
DatabricksSecrets
| where TimeGenerated > endtime
| where ActionName == "getSecret"
| extend RequestParams = parse_json(RequestParams), Identity = parse_json(Identity)
| extend Key = RequestParams.key, Scope = RequestParams.scope, Email = Identity.email
| summarize count() by bin(TimeGenerated, 1d), tostring(Email), tostring(Key), tostring(Scope)
| where Scope contains "prd"
| render timechart with (yaxis=log)
Repeated Unauthorized Data Access Requests
Similar to searching for unauthorized logon attempts, we can look for other-than-200 response codes from Unity Catalog.
Two things jump out looking at our logs.
- There are a lot of
TABLE_DOES_NOT_EXISTevents. This could just be an automation misconfiguration or fat finger, but could also be a brute force attempt. We may want to alert when there are a certain number of events like this with different table names. - The standard
PERMISSION_DENIEDerrors, which will require some alerting.
For the first case, I want to look for failures that are above a certain threshold, which may indicate someone trying to brute force item names. Based on my data, anything over probably 35 unique item access attempts per day is likely appropriate.
DatabricksUnityCatalog
| extend Response = parse_json(Response), Identity = parse_json(Identity)
| where Response.statusCode == 404
| extend exception = tostring(split(Response.errorMessage, ": ", 1)), tostring(itemName = split(Response.errorMessage, ": ", 2))
| summarize UniqueItems=count_distinct(itemName) by bin(TimeGenerated, 1d), tostring(Identity.email), exception
| where UniqueItems > 50
For the second case, we again are just looking for a high rate of Permission Denied errors (403). I am choosing an arbitrary number here but in our logs, anything over probably 90 events per user per day are worthy of investigation.
DatabricksUnityCatalog
| extend Response = parse_json(Response), Identity = parse_json(Identity)
| where Response.statusCode == 403
| extend email = tostring(Identity.email)
| summarize count() by bin(TimeGenerated, 1d), email
| where count_ > 90
Antivirus Scan Infected Files Detected & Suspicious Host Activity
These two are fairly simple, similar to the Databricks Access to Customer Environments and the DatabricksGenie table. There are specific tables for these events.
DatabricksClamAVScan for malicious files and DatabricksCapsule8Dataplane for file integrity monitoring.
Both of these tables will only have data if the Enhanced Security Monitoring options are enabled for your Databricks deployment.
Data Exfiltration
The first recommendation is the same as the previous Threat Model item. So no additional work required there. There is also a general recommendation for monitoring user account activity via Entra ID, which is out of the scope of this post.
Insider Threats
The first recommendation links to a new blog article.
The article focuses specifically on AWS, but then dives into utilizing the Capsul8 functionality in the Databricks deployment, which Azure provides with the Enhanced Security Controls. If you have this enabled, simply monitor the DatabricksCapsule8Dataplane table.
The second recommendation is again, back to the same blog post from the "Account takeover or compromise" section. Lastly, a general recommendation to monitor Azure logs, which is outside the scope of this blog.
Supply Chain Attacks
This section of the original document includes links and recommendations that are addressed in previously discussed sections.
Potential compromise of the cloud provider and/or Azure Databricks
This section of the original document includes links and recommendations that are addressed in previously discussed sections.
Ransomware attacks
This section of the original document includes links and recommendations that are addressed in previously discussed sections.
Resource abuse
The final threat model has some additional recommendations around cost monitoring and budgets to detect this type of attack.
These are generally handled by infrastructure/engineering teams and not by the security team. As security practitioners, we should have a good enough relationship with those teams to ask the questions and have a good understanding of what is in place.
Conclusion
Hopefully these queries can be used to defend your environment or give you ideas for additional queries and/or hunt operations.